Usage analytics
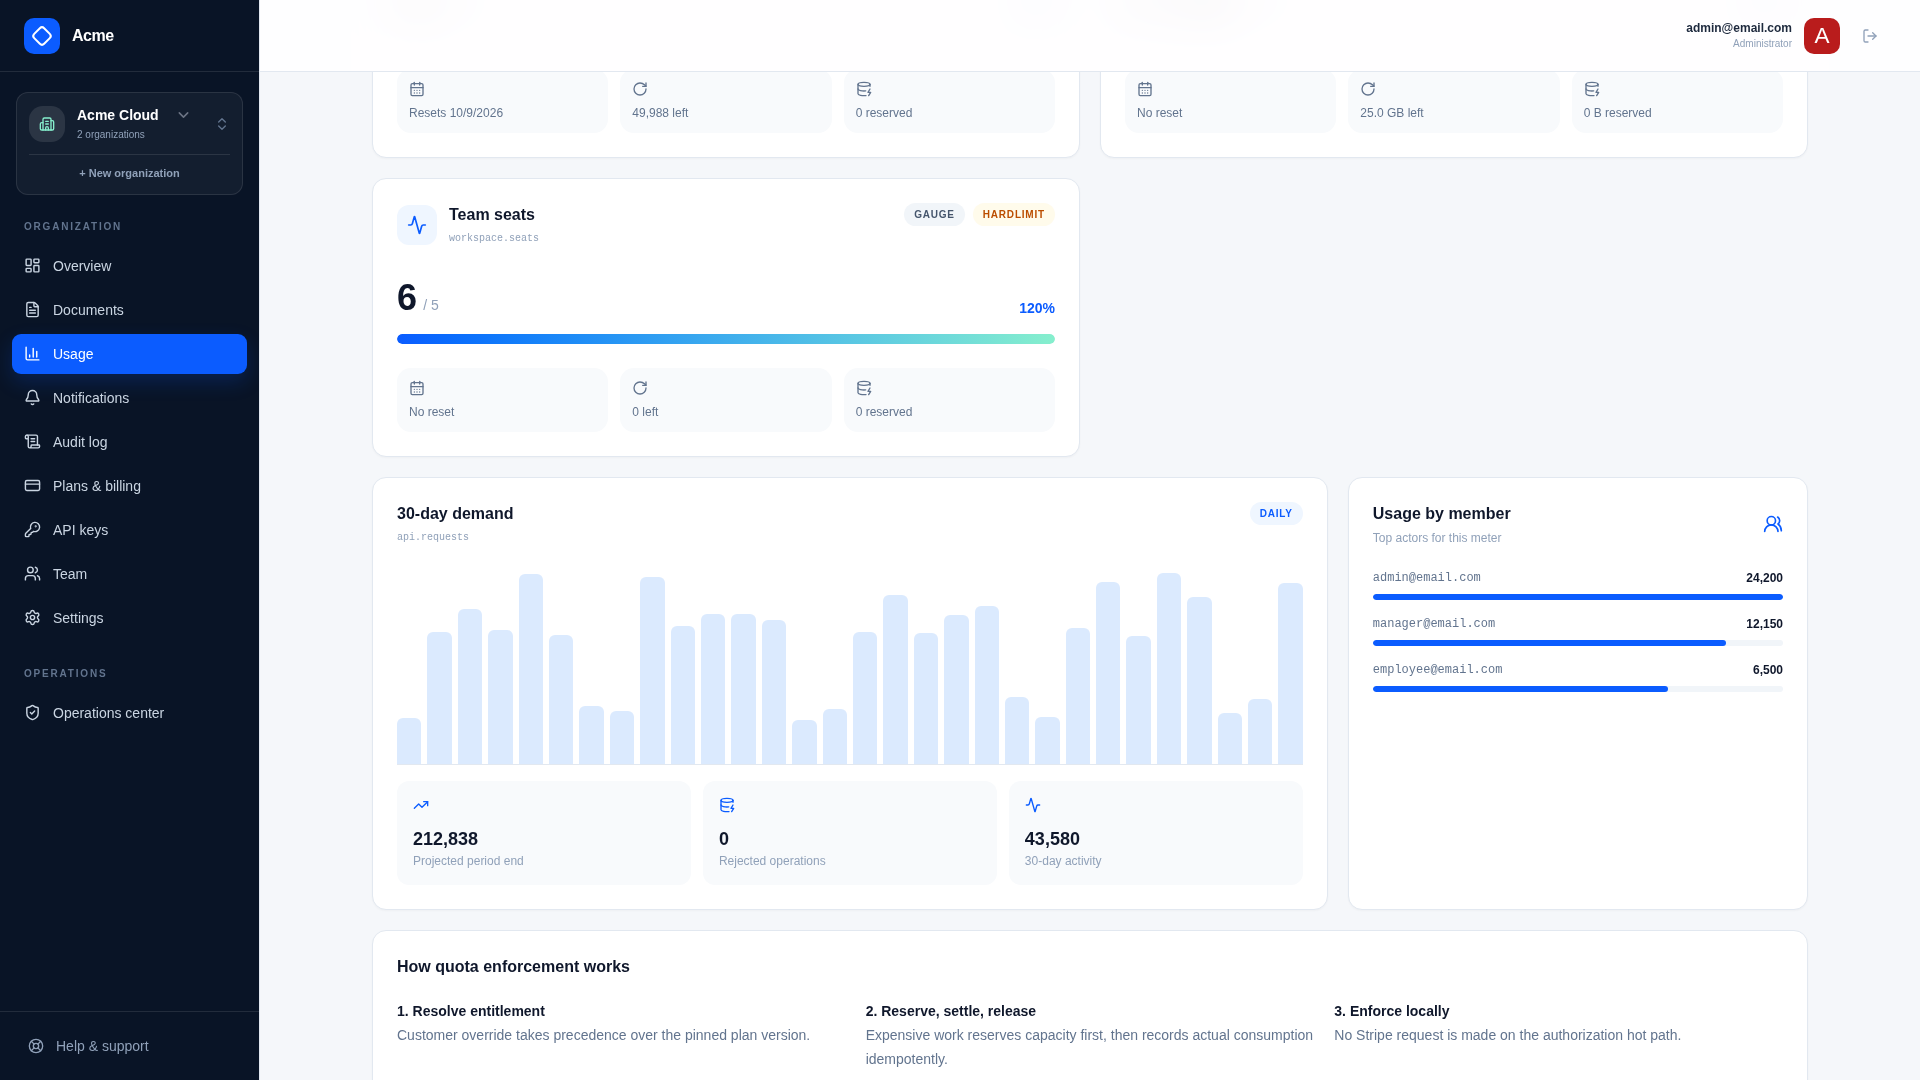
Usage analytics turns the same normalized meter events used for enforcement into customer and operator visibility.
Customer APIs
GET /saas/usage/analytics?meterKey={key}&days={7..365}— current summaries, daily series, per-user breakdown, rejected operations, and period-end projection.GET /saas/usage/export?meterKey={key}&days={7..365}— CSV export.
Both require analytics.basic. Advanced breakdowns can be gated with analytics.advanced when extending the UI. The requested window is clamped to configured retention.
The /usage page should fetch when the organization, meter, or date range changes. Keep request parameters and callback dependencies stable to avoid render-driven request loops.
Data flow
Successful quota operations append UsageEvent rows and update period aggregates. BuildUsageRollupsCommand periodically writes UsageDailyRollup rows by organization and, when allowed by the meter definition, by user. Analytics reads rollups and falls back to raw events when a rollup is not yet available.
Saas.AnalyticsRetentionDays controls the global history window. Each meter's AllowCustomerBreakdown and AllowUserBreakdown flags control safe dimensions; do not add high-cardinality or sensitive dimensions casually.
SaaS-admin analytics
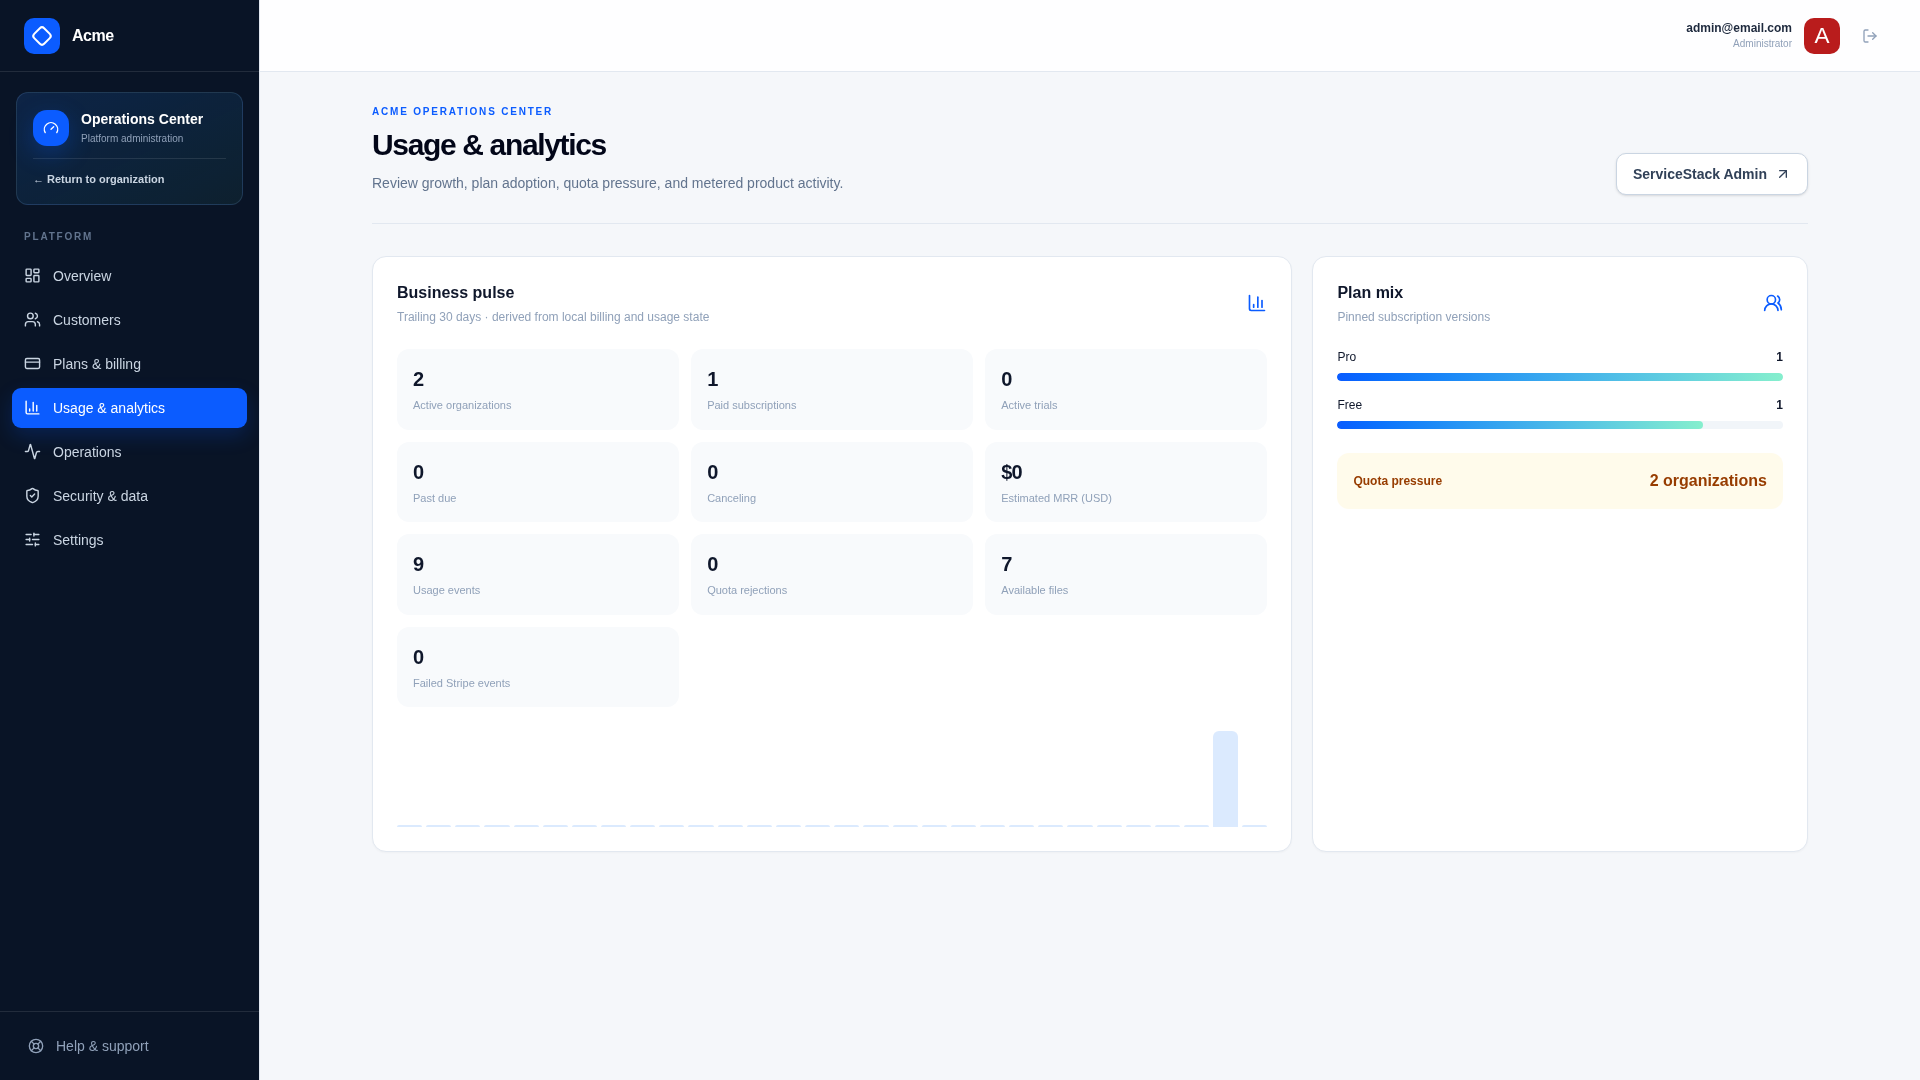
GET /saas/admin/analytics provides platform metrics, organization growth, plan mix, and quota pressure for Admin users. These appear at /admin/usage and in the /admin overview. Customer 360 at /admin/customers includes current usage summaries for support and billing diagnosis.
Adding analytics to a feature
- Register a meter in
Saas.Meters. - Add allowances to relevant plan drafts and publish them.
- use reserve/settle for fallible or variable work, or atomically consume for simple work;
- record a stable action/source and actor for useful attribution;
- add customer-safe visualization and CSV labels;
- verify hard-limit rejection and period rollover.
Do not maintain a separate analytics counter beside quota state. One metering path prevents billing, enforcement, and dashboards from disagreeing.
Verify
Generate accepted and rejected operations across several users and days. Compare aggregate, chart, projection, and CSV values; run rollups more than once; test a reset boundary, retention cutoff, disabled breakdown, and organization isolation.
Related documentation
File storage
The Acme sample stores ordinary files to demonstrate feature gates, document-count quotas, byte quotas, idempotency, analytics, and cleanup without imposing a document-processing domain.
Notifications
The notification subsystem provides in-app and email delivery, customer preferences, deduplication, retries, and an operator failure queue.